Tulane University, long regarded as one of the most respected institutions in the South, has undergone a dramatic shift in its admissions profile over the past decade.
What once stood as a moderately selective university has transformed into one of the most competitive schools in the nation, drawing applications from thousands of high-achieving students across the country and around the world.
A steady rise in academic standards, changes in standardized testing policy, and an intentional reshaping of the student body have all played a role in reshaping Tulane’s image and admissions strategy.
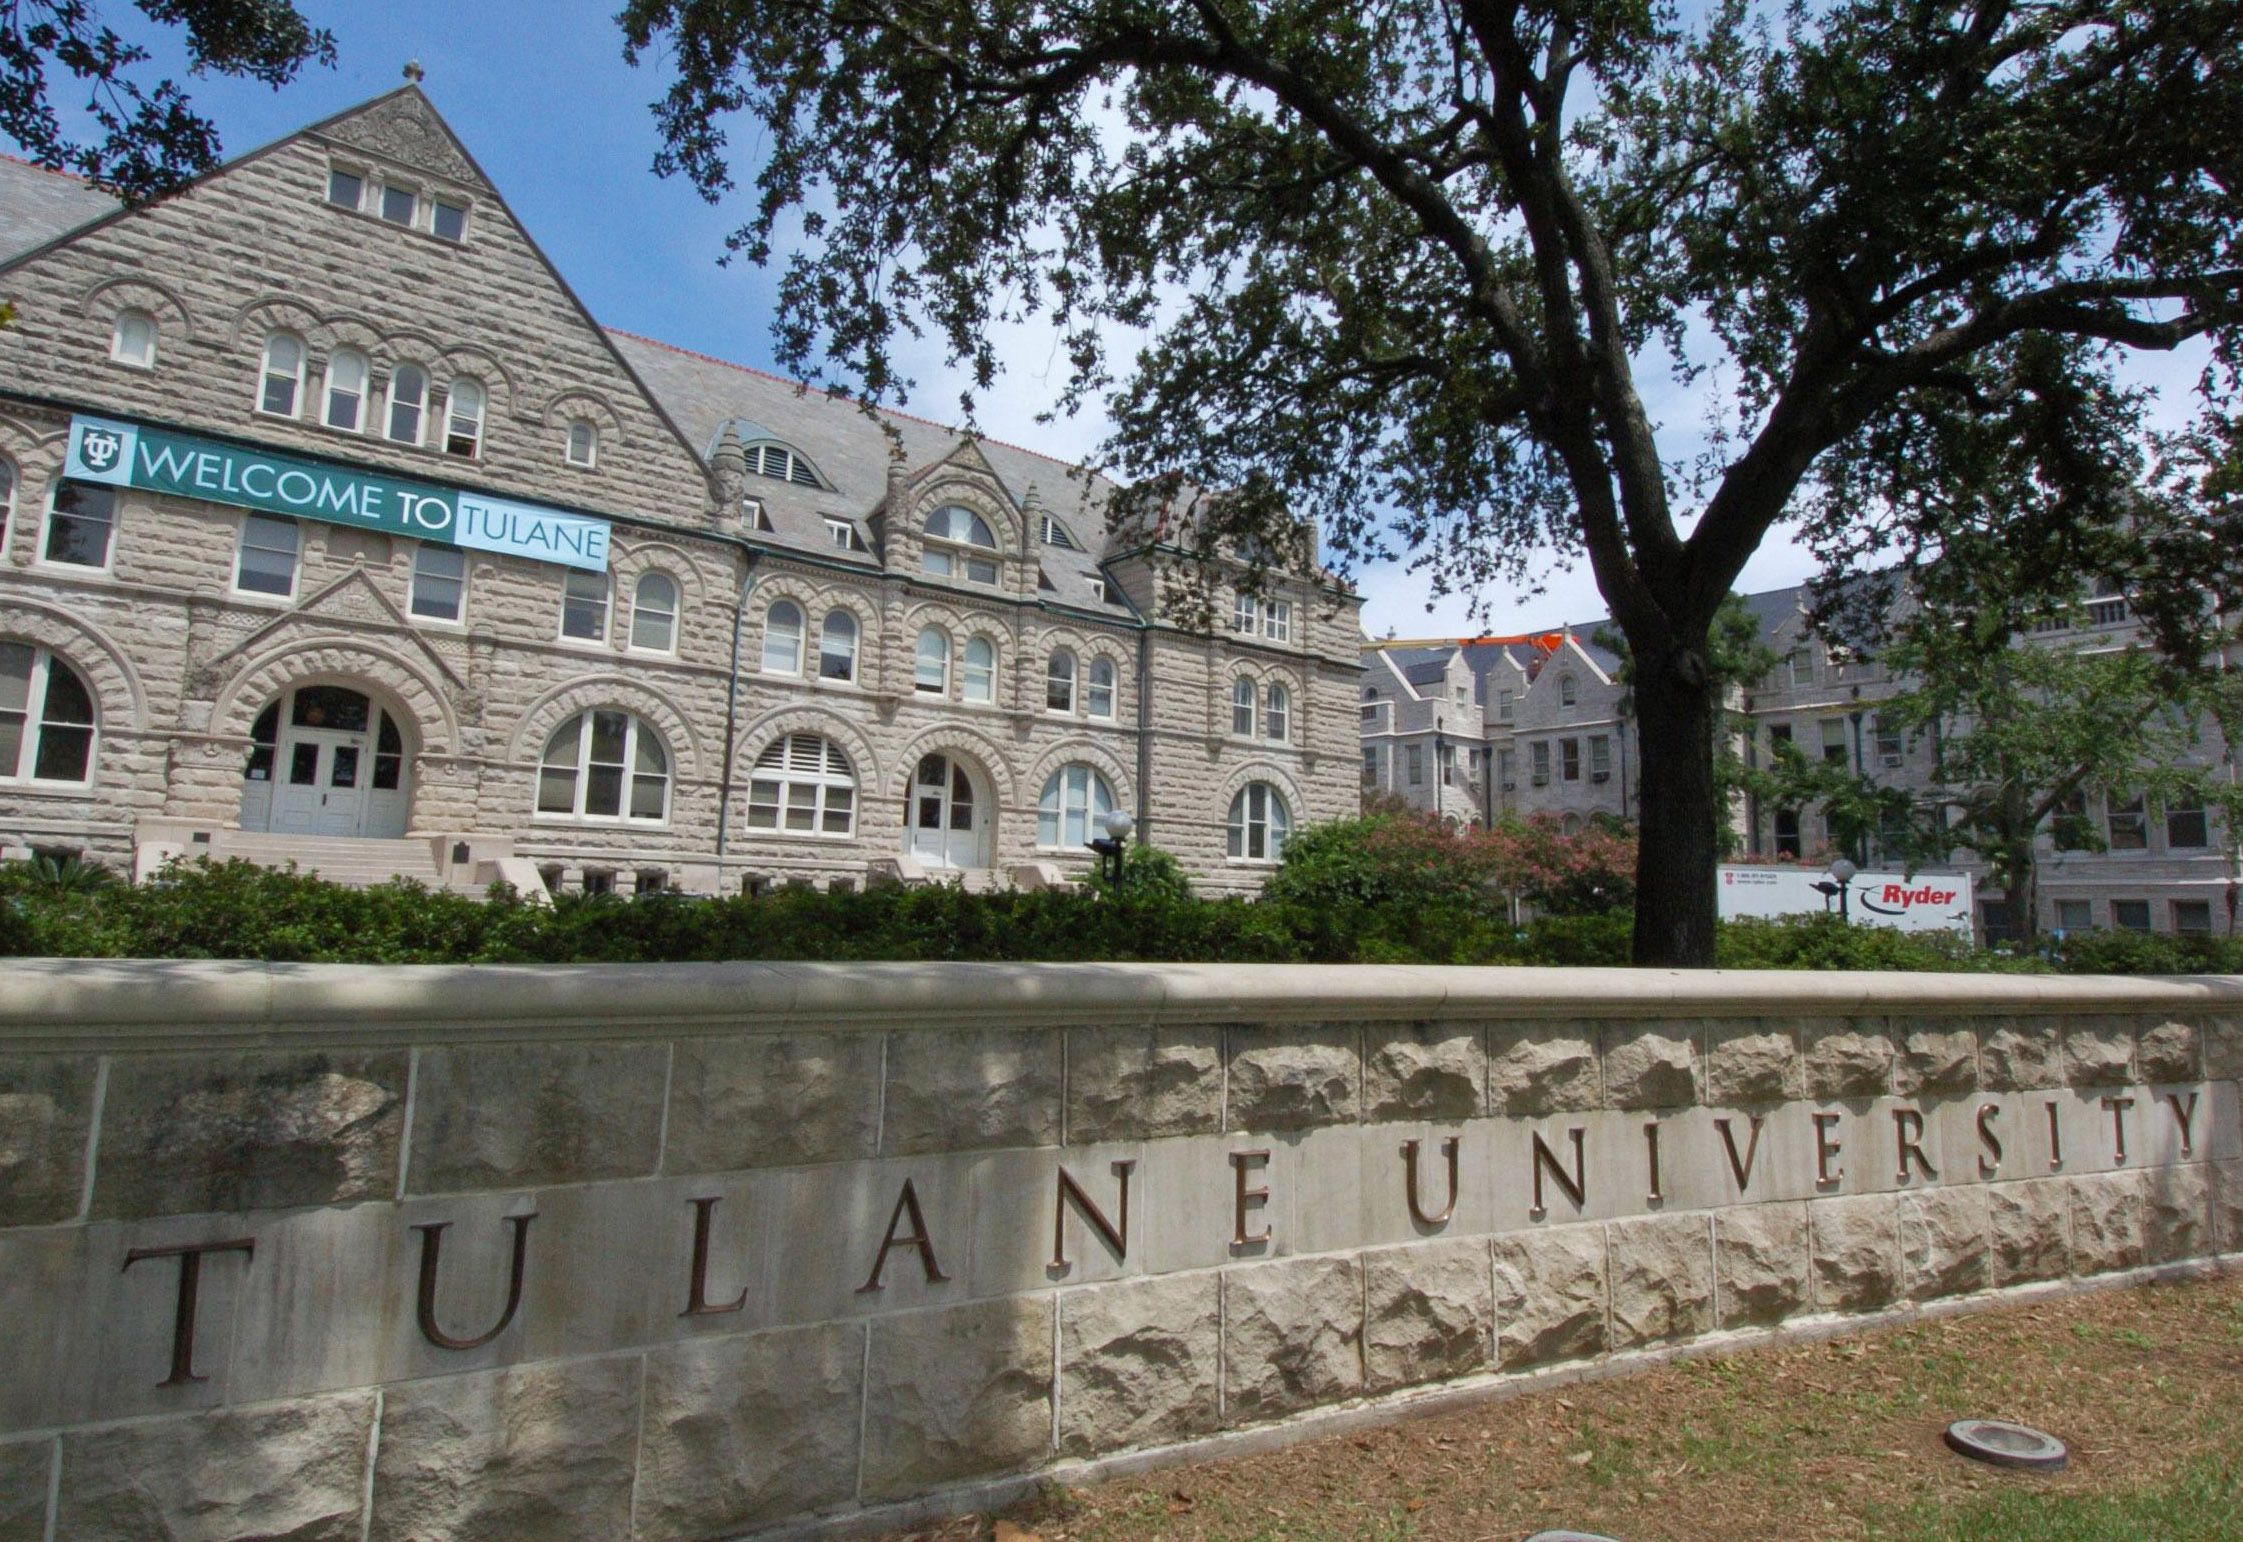
Walking through Gibson Hall today, it is clear that the landscape has changed. Ten years ago, Tulane admitted nearly a third of its applicants. Today, that figure has dropped to below 15 percent.
The numbers alone tell part of the story, but behind the data lies a strategic recalibration that reflects broader trends in American higher education. Admissions officers now review applications in an environment marked by rising demand, competitive yield strategies, and a heightened focus on institutional rankings.
This report breaks down year-by-year figures, outlines key admissions shifts, and explains what caused Tulane’s transformation into a highly selective university.
Tulane University Acceptance Rates (2015-2024)
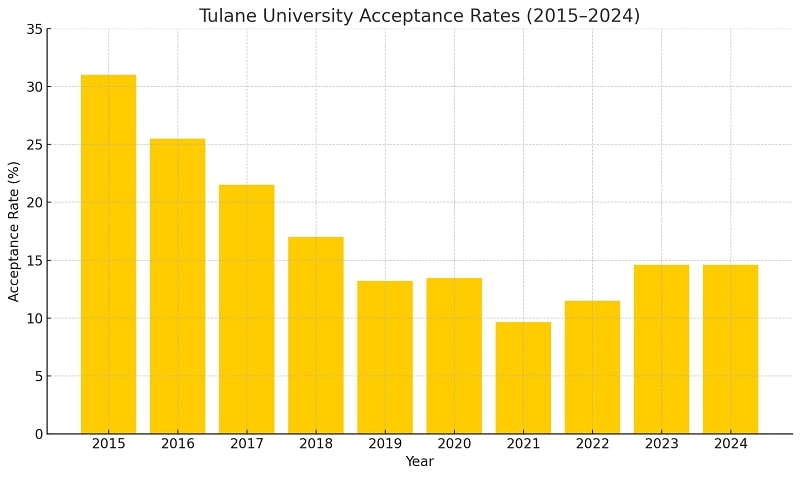
The average acceptance rate over this period is 18.28%.
Recent Admissions Data
- Applications: In 2024, Tulane received 33,468 applications and admitted 4,879 students.
- Yield Rate: The yield rate, indicating the percentage of admitted students who enrolled, was 45.79% in 2024.
- Test Scores: For the Class of 2028, the average SAT score was 1490, and the average ACT score was 33.
Key Drivers Behind the Decline
Tulane’s strategy involved multiple coordinated decisions. Some were internal policy changes. Others followed national shifts in how students applied and how universities marketed themselves.
Rise in Application Volume
More students applied to Tulane over time. In 2015, total applications barely crossed 30,000. By 2024, the number reached nearly 34,000. This occurred without a comparable increase in class size.
The same number of seats, filled from a larger pool, naturally lowered the acceptance rate.
Marketing efforts played a role. Tulane targeted high-achieving students in various regions, including the Northeast and California. It also sent more personalized outreach than in previous years.
Test-Optional Policy and Pandemic Effects
Tulane moved to a test-optional admissions model, first in response to the pandemic and later as a permanent or semi-permanent adjustment.
That decision increased the number of applicants who felt competitive. Students who might have skipped applying due to lower standardized scores now felt encouraged.
The result was a broader application pool with more variance in GPA, recommendation letters, and personal essays.
Shift in Strategic Enrollment Planning
University leadership made a conscious decision to boost Tulane’s national ranking. Acceptance rate factors into rankings, but so does yield-the percentage of admitted students who actually enroll.
Tulane began issuing a limited number of merit scholarships earlier in the cycle to high-priority candidates. It also favored applicants who demonstrated a high level of interest.
This approach discouraged students using Tulane as a backup and improved yield numbers.
Academic Profile of Admitted Students
View this post on Instagram
The strength of admitted students grew in step with selectivity. Tulane moved into a bracket that now includes schools like USC and Wake Forest.
In 2015, admitted students generally had SAT scores in the mid-1200s to low 1300s. Today, the average SAT score is near 1490. ACT scores also rose, with 33 now standing as a median.
These gains reflect stronger academic resumes, more AP coursework, and increased polish in personal narratives.
High school class rank plays a larger role now. Tulane heavily favors students who place in the top 10 percent of their graduating class.
View this post on Instagram
GPA Trends Among Admitted Students
| Year | Average GPA (Unweighted) |
|---|---|
| 2015 | 3.6 |
| 2018 | 3.8 |
| 2021 | 3.9 |
| 2024 | 3.94 |
Tulane’s average GPA now rivals or exceeds some Ivy League schools. High grades alone do not guarantee admission.
The holistic review process means essays, interviews, and recommendations can carry disproportionate weight in borderline decisions.
Early Decision and Demonstrated Interest
Tulane uses Early Decision and Early Action programs to shape its incoming classes. Early Decision has become the most reliable path to admission, with an acceptance rate more than double the Regular Decision rate in some years.
Demonstrated interest also plays a key role. Tulane tracks campus visits, virtual info sessions, and email engagement. Students who show consistent contact and communication with admissions officers are more likely to receive offers.
This approach favors students who approach their application with intentionality. It also signals that Tulane expects students to treat the process as a two-way relationship, not a blind submission.
Demographic and Geographic Shifts
Tulane has also broadened the geographic and demographic makeup of its student body. A decade ago, most students came from Louisiana, Texas, and nearby Southeastern states.
Today, Tulane draws large populations from New York, Illinois, California, and abroad.
Students of color represent a growing percentage of each entering class. International applicants have also increased, aided by Tulane’s global partnerships and increased recruiting efforts.
States Sending the Most Students
| Rank | State |
|---|---|
| 1 | Louisiana |
| 2 | California |
| 3 | New York |
| 4 | Texas |
| 5 | Illinois |
By expanding its outreach, Tulane has created a more diverse campus environment, not just racially but also culturally and socioeconomically.
Yield Rate and Class Composition
Yield rate measures how many admitted students actually choose to enroll. For many years, Tulane struggled in this area. It offered admission to many students who saw it as a backup to more selective institutions.
That pattern changed when Tulane reshaped its scholarship model and communications strategy.
Yield rates rose, especially in Early Decision pools. The current yield stands near 46 percent, up from about 23 percent a decade ago. Higher yield reflects Tulane’s improved reputation and applicant targeting.
Smaller admitted classes mean higher engagement and retention. Tulane has invested in housing, counseling, and academic support systems to ensure students persist through graduation.
Public Perception and Rankings Impact
Admissions changes influenced Tulane’s rankings. Lower acceptance rates, stronger incoming classes, and higher yield scores led to notable jumps in national listings. Media coverage followed, which helped boost applications further.
Prospective students now place Tulane on the same list as Boston College, Emory, and the University of Virginia. Its selectivity gives it prestige, but also raises expectations for academic rigor and post-graduation outcomes.
Parents, counselors, and education consultants now include Tulane in lists for high-performing students who previously targeted only Top 20 institutions. This shift validates the admissions strategy and cements Tulane’s new identity.
What This Means for Future Applicants

Anyone considering Tulane should recognize that admission today is not comparable to ten years ago. Students need top academic metrics, but also meaningful extracurricular involvement and compelling essays.
Applicants must show interest early. They should take advantage of virtual and in-person outreach opportunities, respond to emails, and submit strong early materials if possible.
Merit scholarships remain competitive. Need-based aid has grown, but students cannot rely on last-minute planning. Strategy matters. Demonstrated interest matters. GPA inflation at high schools has made raw numbers less useful.
Tulane, like other selective institutions, looks for consistent academic performance across challenging coursework.
Conclusion
Tulane University has spent the last ten years refining its admissions strategy with precision and consistency. The data reflects a permanent shift. The acceptance rate has dropped significantly.
The academic profile of admitted students has become stronger. Each entering class shows higher test scores, stronger GPAs, and more selective criteria for admission.
Applicants today face a competitive process shaped by strategic planning, national recruitment, and a clear emphasis on academic excellence.
The university has positioned itself among the most selective institutions in the country, and its reputation reflects that shift. Students who wish to gain admission now must demonstrate more than academic readiness.
They must also show commitment, interest, and alignment with Tulane’s academic and community values. Over the next decade, continued selectivity and increased demand will likely push the bar even higher.
Read Next – What to Include in a Letter of Continued Interest?